Chapter 2 Overview
Welcome.
This is a 2-day training workshop to learn R, RStudio, Git, and GitHub, and it’s going to be fun and empowering. You will learn a reproducible workflow that can be used in analyses of all kinds, including Ocean Health Index assessments. This is really powerful, cool stuff, and not just for data: I made and published this book using those four tools and workflow.
We will practice learning three main things all at the same time: coding with best practices (R/RStudio), collaborative version control (Git/GitHub), and communication/publishing (RMarkdown/GitHub). This training will teach these all together to reinforce skills and best practices, and get you comfortable with a workflow that you can use in your own projects.
2.1 What to expect
This is going to be a fun workshop.
The plan is to expose you to a lot of great tools that you can have confidence using in your research. You’ll be working hands-on and doing the same things on your own computer as we do live on up on the screen. We’re going to go through a lot in these two days and it’s less important that you remember it all. More imporatantly, you’ll have experience with it and confidence that you can do it. The main thing to take away is that there are good ways to approach your analyses; we will teach you to expect that so you can find what you need and use it! And, you can use these materials as a reference as you go forward with your analyses.
We’ll be talking about :
- how to THINK about data. And not just any data; tidy data.
- how to increase reproducibility in your science
- how to more easily collaborate with others–including your future self!
- how the #rstats community is fantastic. The tools we’re using are developed by real people. They are building great stuff and helping people of all skill-levels learn how to use it.
Everyone in this workshop is coming from a different place with different experiences and expectations. But everyone will learn something new here, because there is so much innovation in the data science world. Even instructors and helpers learn something new every time, from each other and from your questions. You are all welcome here and encouraged to help each other.
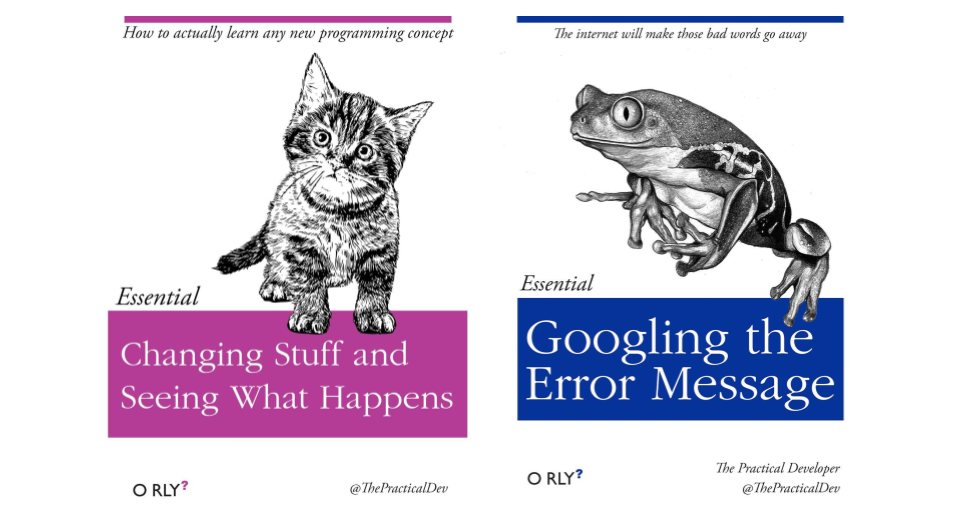
Here are some important themes throughout (these are joke book covers):
2.1.1 Tidy data workflow
We will be learning about tidy data.
Hadley Wickham has developed a ton of the tools we’ll use today. Here’s an overview of techniques to be covered in Hadley Wickham and Garrett Grolemund of RStudio’s book R for Data Science:
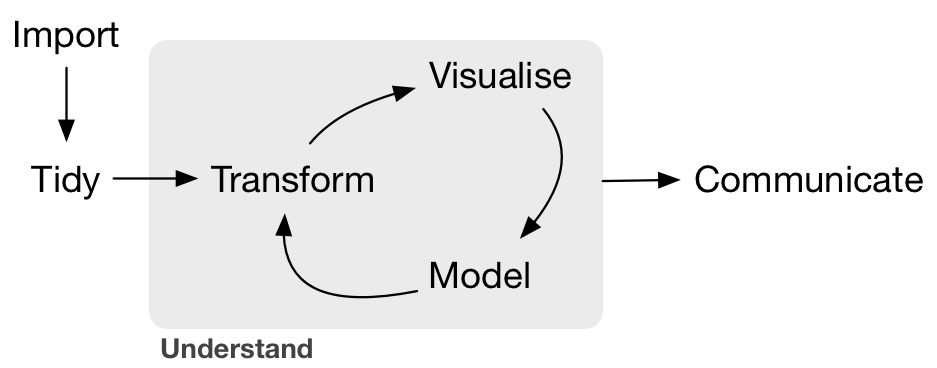
We will be focusing on:
- Tidy:
tidyrto organize rows of data into unique values - Transform:
dplyrto manipulate/wrangle data based on subsetting by rows or columns, sorting and joining - Visualize:
ggplot2static plots, using grammar of graphics principles
- Communicate
- online website with Github Pages
- version with git
- dynamic documents with Rmarkdown
2.2 Gapminder data
We’ll be using the gapminder dataset, which represents the health and wealth of nations. It was pioneered by Hans Rosling, who is famous for describing the prosperity of nations over time through famines, wars and other historic events with this beautiful data visualization in his 2006 TED Talk: The best stats you’ve ever seen:

While these data are not specifically oriented around conservation or the environment, it is a fantastically rich data set with many parallels to data you may have and wrangling you will need to do. We learn through metaphor, and there are various indicators, across multiple study sites, and over many years.
2.3 By the end of the course…
By the end of the course you’ll wrangle the gapminder data, make your own graphics that you’ll publish on a webpage you’ve built with GitHub and RMarkdown. Woop!
I made this training book with GitHub and RStudio’s RMarkdown, which is what we’ll be learning in the workshop.
2.4 Prerequisites
Before the training, please make sure you have done the following:
- Have up-to-date versions of
Rand RStudio and have RStudio configured with Git/GitHub- Download and install R: https://cloud.r-project.org
- Download and install RStudio: http://www.rstudio.com/download
- Create a GitHub account: https://github.com Note! Shorter names that kind of identify you are better, and use your work email!
- Get comfortable: if you’re not in a physical workshop, be set up with two screens if possible. You will be following along in RStudio on your own computer while also watching a virtual training or following this tutorial on your own.
2.5 Credit
This material builds from a lot of fantastic materials developed by others in the open data science community. In particular, it pulls from the following resources, which are highly recommended for further learning and as resources later on. Specific lessons will also cite more resources.
- R for Data Science by Hadley Wickham and Garrett Grolemund
- STAT 545 by Jenny Bryan
- Happy Git with R by Jenny Bryan
- Software Carpentry by the Carpentries